Indicator Overlay
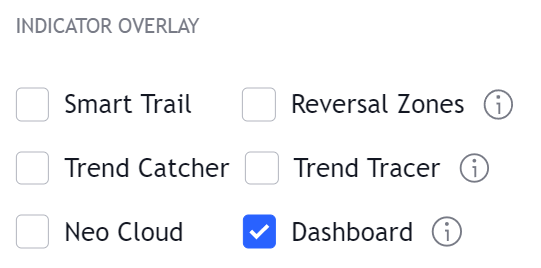
The LuxAlgo Signals & Overlays Indicator allows the user to display various technical indicators directly to their chart. These can be used in confluence with the confirmation/contrarian signals or as standalone. Each of these indicators are covered below.
info
Other settings do not affect these indicators.
Smart Trail
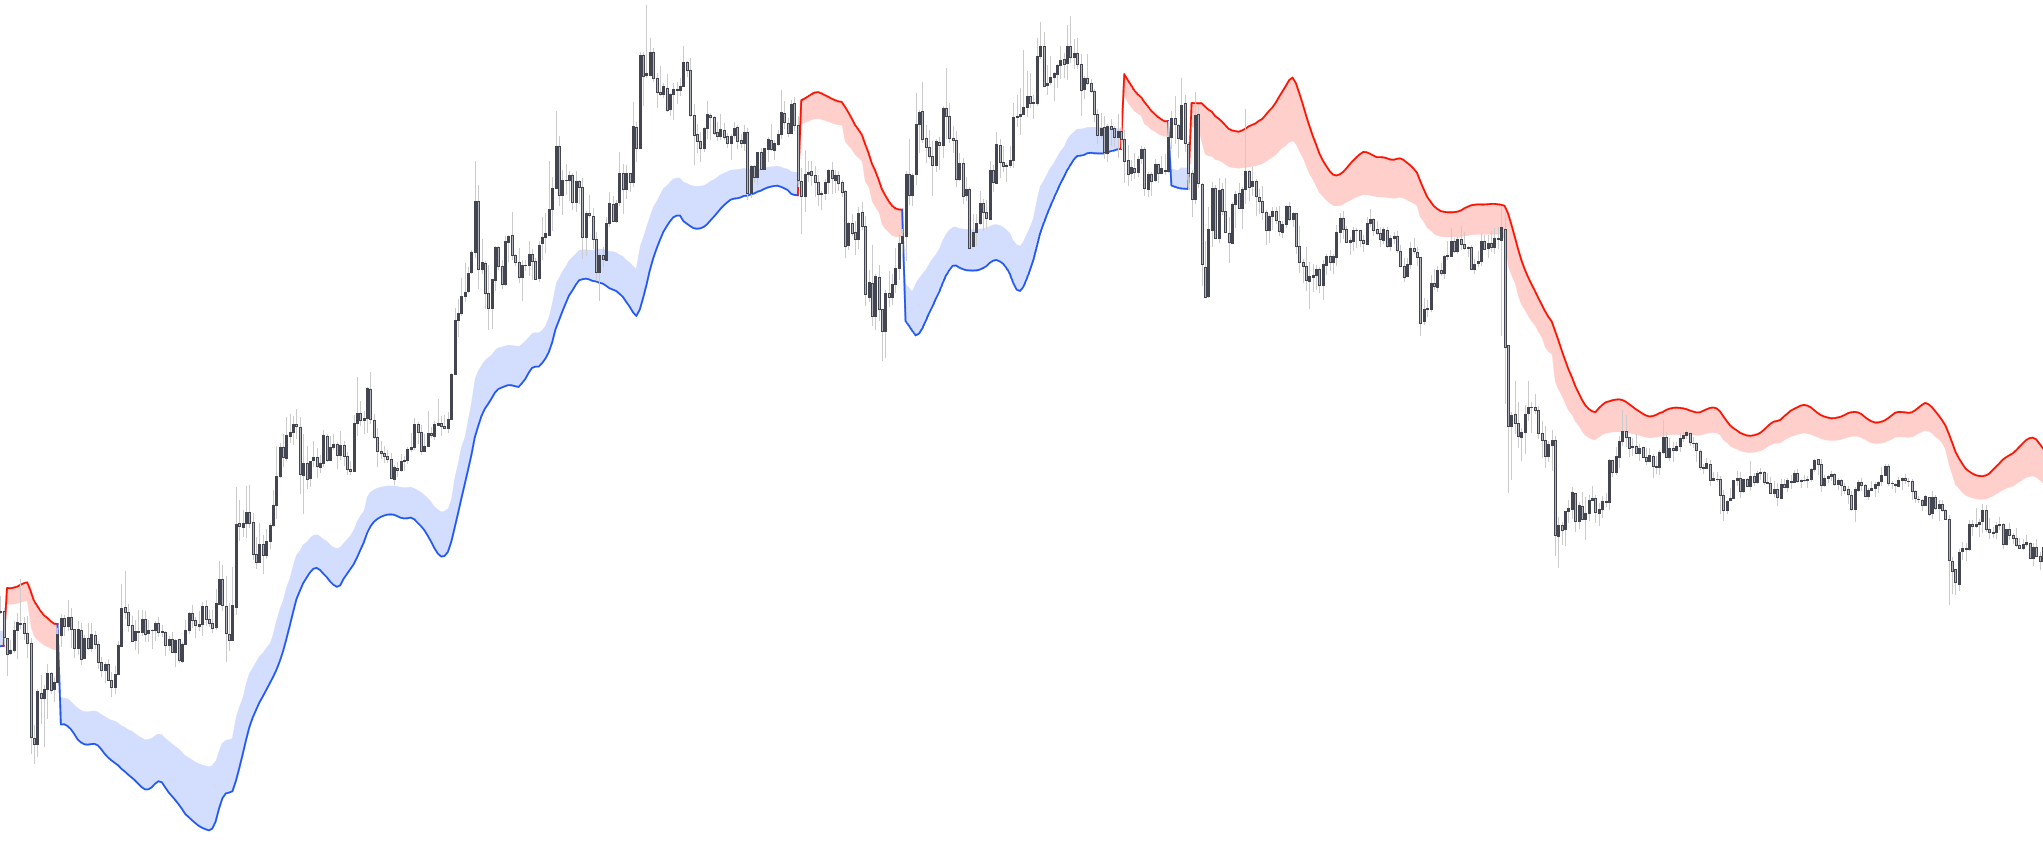
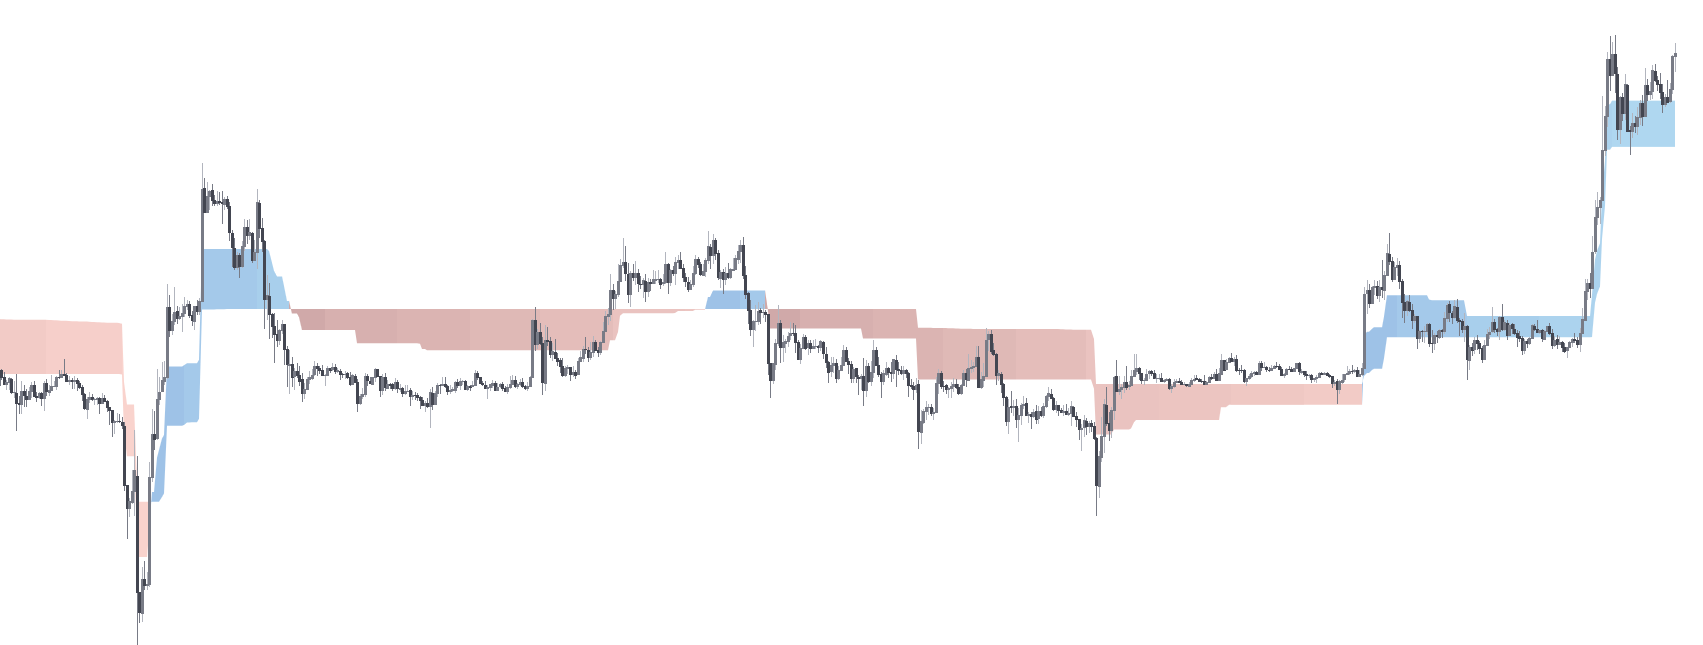
The smart trail is a trailing stop that diverges from the price in the presence of unwanted price variations in a trend.
An up-trend is indicated when price is above the trailing stop, and a down-trend when price is below the trailing stop.
Support (in blue) and resistance (in red) areas are also displayed by the smart trail and aims to indicate when price might reverse when entering the area.
Reversal Zones
When enabled, one upper and one lower zone will be displayed on your chart, each zone is designed to help the user find tops and bottoms whether the market is ranging or trending (however the indicator will still be more effective during ranging markets).
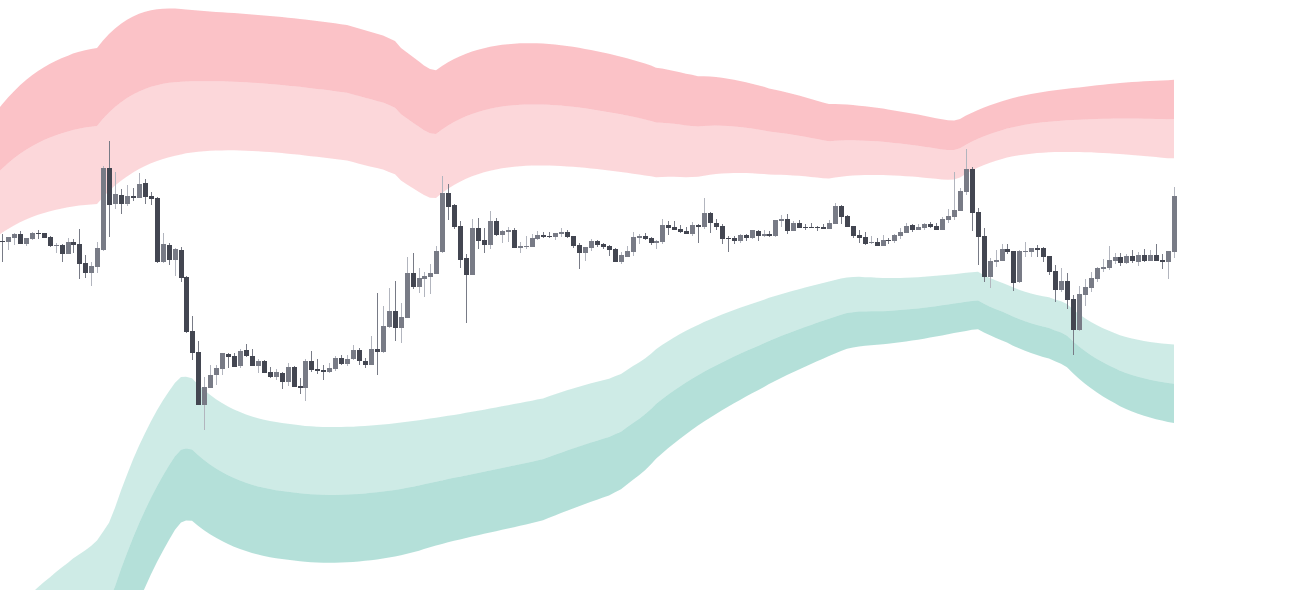
These zones can be great areas to take profit or find early entries to use alongside the confirmation or contrarian signals.
info
During periods of increased volatility, the price may move outside the zones, you can wait for the price to go back within each zone to take a decision.
Trend Tracer
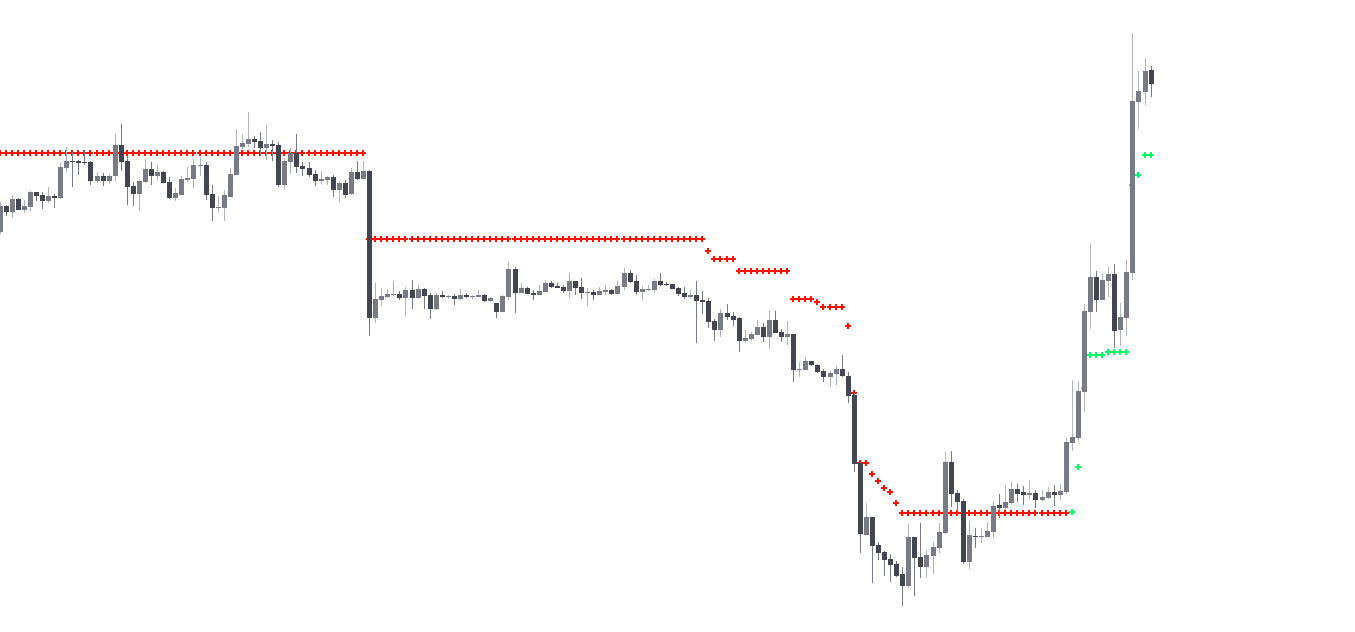
The trend tracer is a trend-following indicator that aims to estimate the underlying trend in the price. When the indicator indicates an uptrend its color will be green, while red in the case of a downtrend.
info
The trend tracer can be used as a trailing support/resistance tool, you can also use it in confluence with the confirmation signals, either by waiting for the price to reach the trend tracer in order to enter a trade corresponding to the current confirmation signal or by filtering shorter-term signals by only trading those in accordance by the trend estimated by the trend tracer.
Trend Catcher

The Trend Catcher is a similar indicator to the previous Trend Tracer, however, it aims to detect very early trends, and is thus more reactive.
Like with the Trend Tracer, the color of the indicator determines the detected trend.
Neo Cloud
When enabled, a simple cloud like indicator will be displayed on your chart. The Neo Cloud is similar in effect to the Ichimoku Cloud, and can determine the current trend direction.
The cloud is filled with a gradient color showing how new a detected trend is, with brighter colors indicating older trends.
This cloud can provide a support when an uptrend is detected or resistance when a downtrend is detected. This makes it pertinent for pertinent entries into precise trades.