Market Structure
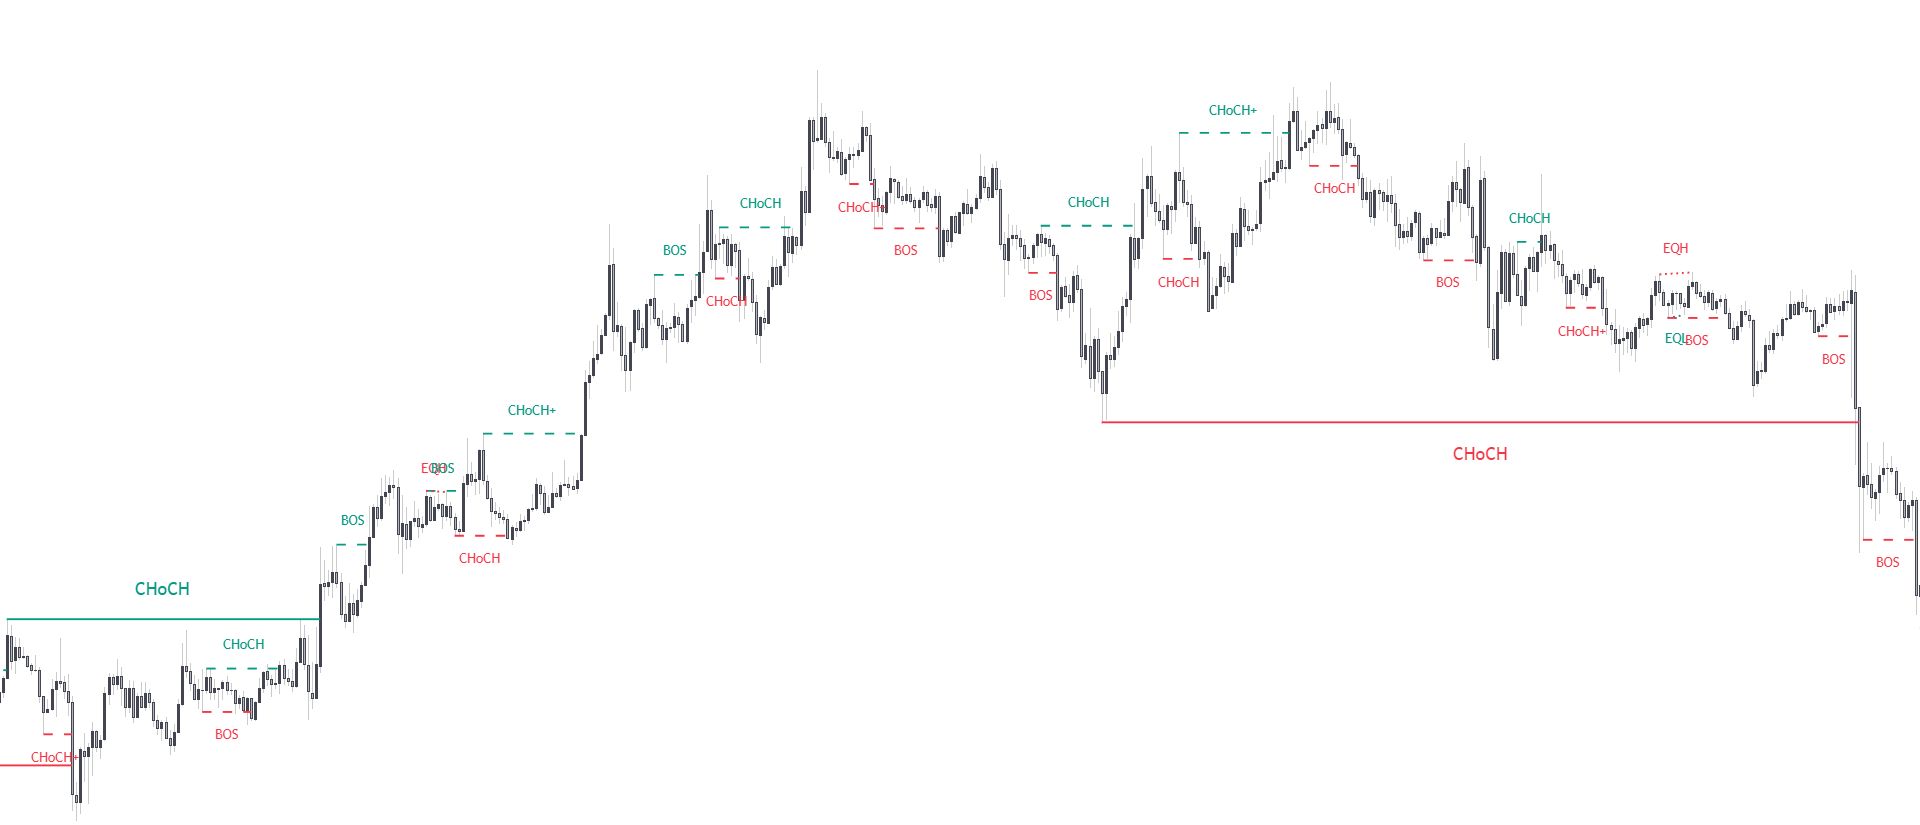
Market structure is a core component of the Smart Money Concepts methodology. The LuxAlgo Price Action Concepts indicator automatically detects and highlights real time market structure on the market, allowing for a wide variety of customisation.
Type Of Market Structure
Market structure allows to determine trend continuations as well as trend reversals in the market trough two distinct structure:
- Change of Character (CHoCH)
- Break of Structure (BOS)
These are further described in the sub sections below.
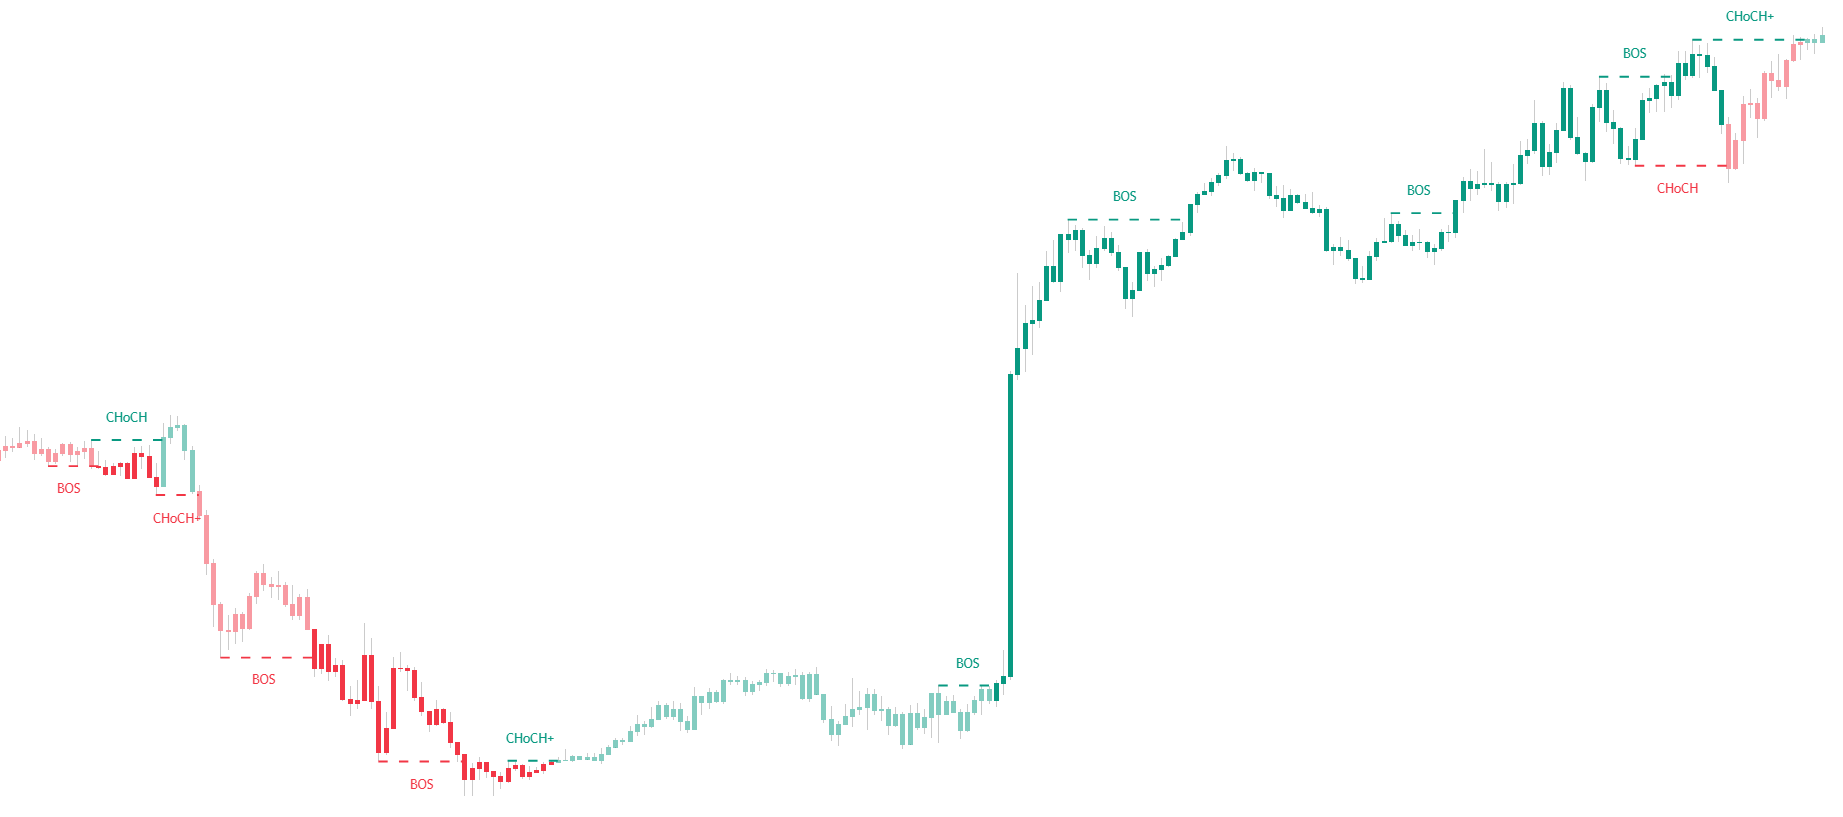
Change Of Character (CHoCH)
A change of character (CHoCH), sometimes also reffered as market structure shift is characterized by price breaking a prior swing low during an uptrend (bullish CHoCH) or a prior swing high during a downtrend (bearish CHoCH), and thus indicates a potential market reversal.
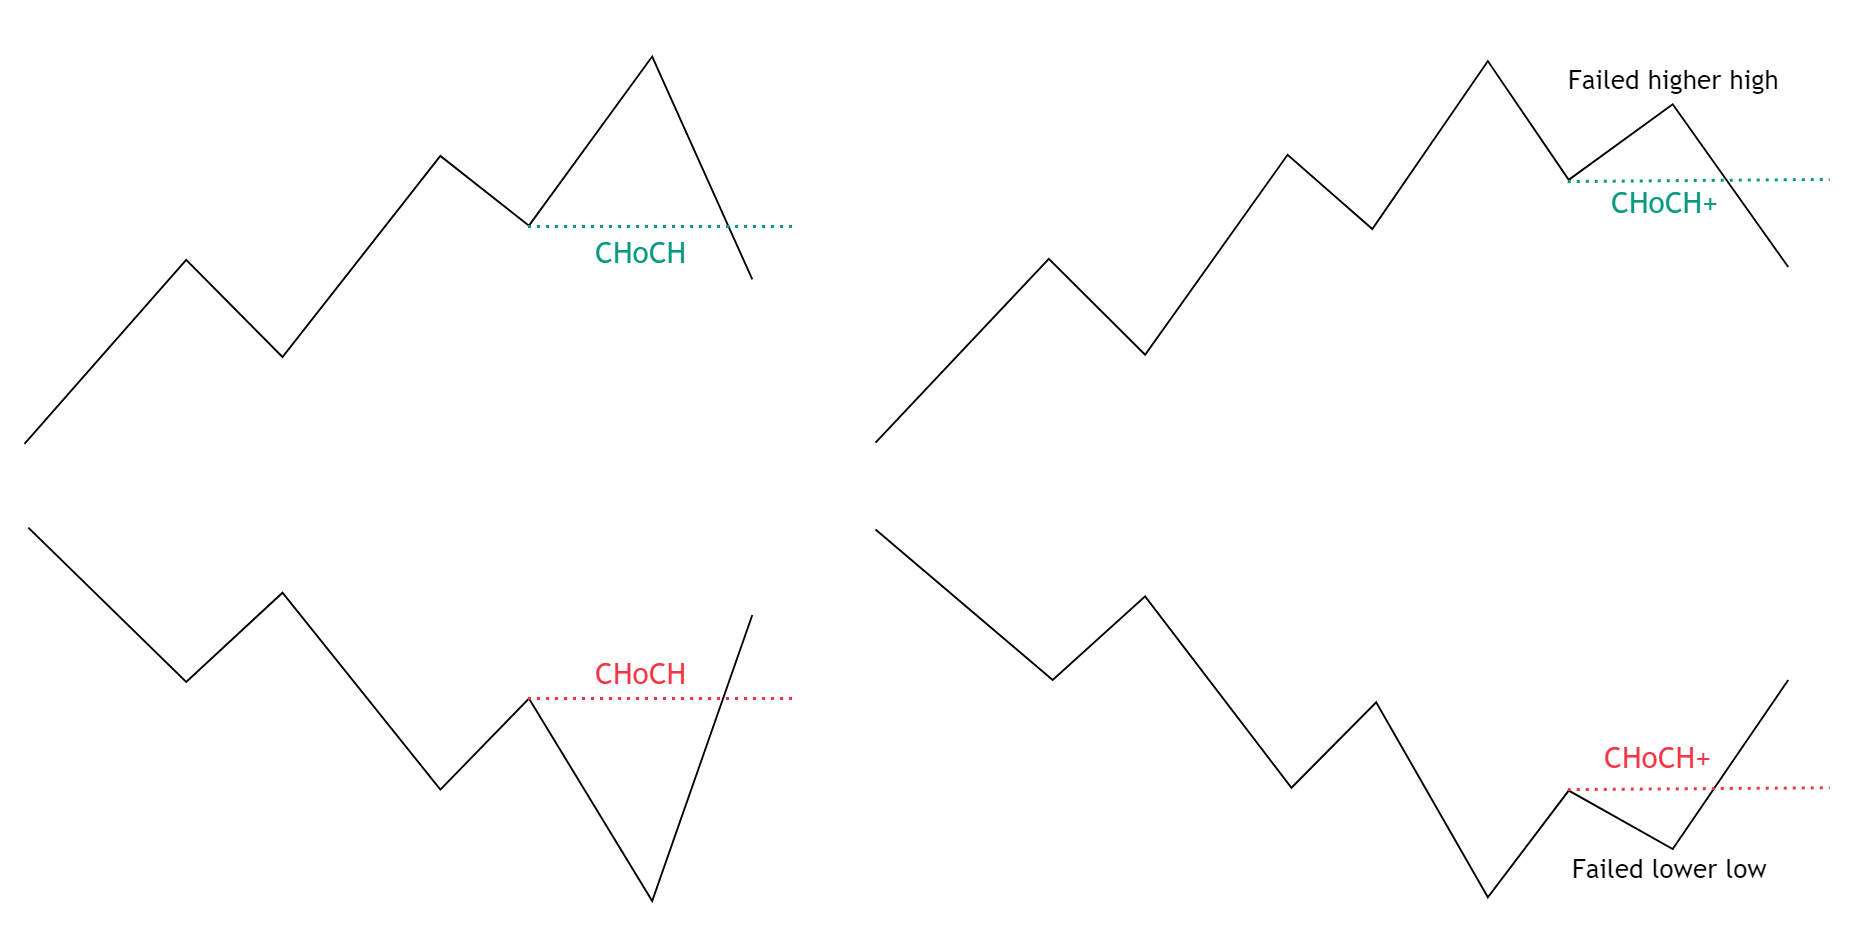
The LuxAlgo Price Action Concepts indicator labels two distincts type of CHoCH:
- Leading CHoCH (labelled as CHoCH)
- Supported CHoCH (labelled as CHoCH+)
The difference between each is based on the relative position of prior swing highs/lows. A leading CHoCH is characterized by not having prior signs of a reversal such as a failed higher high (lower high) during an uptrend or a failed lower low (higher low) during a downtrend.
However a supported CHoCH (CHoCH+) is preceeded by an early sign of market reversal, such as a failed higher high (lower high) during an uptrend or a failed lower low (higher low) during a downtrend.
info
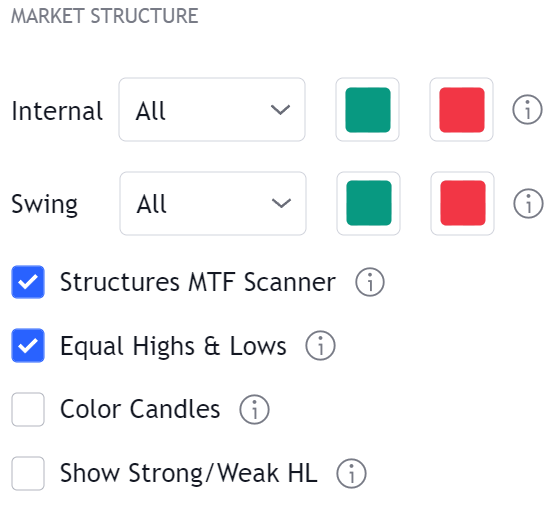
Users can show allow the toolkit to show all or only specific types of CHoCH's from the drop down menus within the Market Structure settings section in the toolkit.
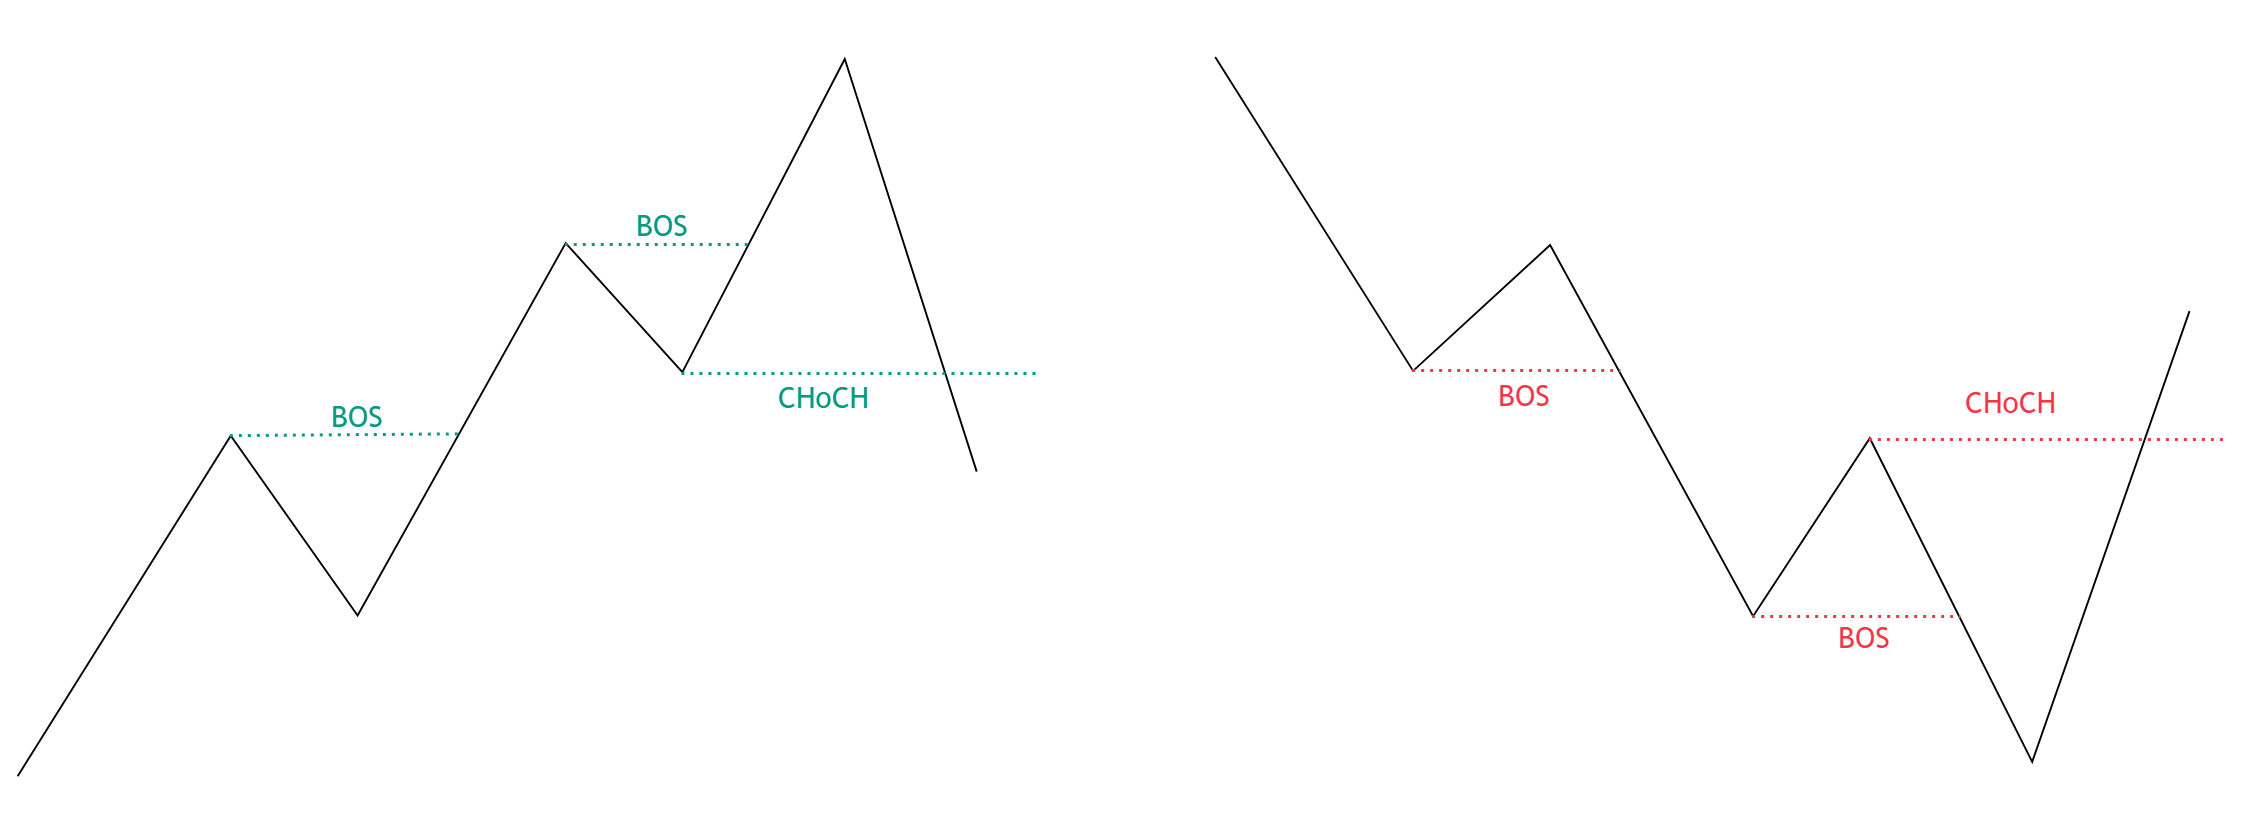
Break Of Structure (BOS)

A break of structure (BOS) can be thought as the opposite of the CHoCH, with a BOS being characterized by price breaking a prior swing high during an uptrend (bullish BOS) thus forming a new higher high, or a prior swing low during a downtrend (bearish BOS) thus forming a new lower low. These structure occurs after a CHoCH.
BOS's do not indicates reversals but continuations of a trend, as such it is common to observe successive BOS in a trend.
Swing & Internal Structure
The LuxAlgo Premium Price Action Concepts offers two distinct dimensions when it comes to market structure:
- Internal Structure
- Swing Structure
Internal structure are constructed from shorter term swing high/low points, while swing structure are constructed from longer term ones.
The toolkit highlights internal structure with dashed lines and labels with a smaller text size.
info
The size of the labels for internal and swing structure can be changed from the General Styling settings section.
Equal Highs & Lows

The toolkit returns historical equal high's & low's constructed from very short term swing points. Equal high's & low's can indicate short term reversals, and incoming market structure such as CHoCH or BOS.
info
Equal high's & low's requires the most recent swing point to be confirmed, which takes 3 bars. As such it is important to understand these are displayed retrospectively.
Structure MTF Scanner
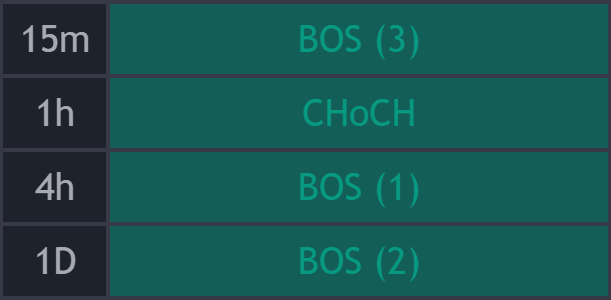
By default a dashboard showing the market sentiment given by the most recent structure (CHoCH/BOS) on different timeframes (15m, 1h, 4h, 1d) of the ticker on the user chart.
Returned BOS's are followed by a number, indicating the number of consecutive BOS succeeding a CHoCH.
Settings affecting the size and location of the dashboard are available in the General Style settings section of the toolkit.
Candle Coloring
Users can color candles depending on the detected internal market structure. This is useful if users want to be able to determine a detected internal market structure without having labels and lines on their chart, freeing up space on the chart to use other indicators.
Candle coloring is affected by the colors settings selected by the user for the internal market structure. Candle coloring is determined as follows:
- Darker bullish color : Bullish CHoCH active
- Regular bullish color : Bullish BOS active
- Darker bearish color : Bearish CHoCH active
- Regular bearish color : Bearish BOS active
info
Users can make highlighted structure and candle colors monochrome from the General Styling settings by using the monochrome option in the Theme drop down menu.
Strong/Weak High/Lows

Strong/Weak High/Lows highlight maximum and minimum levels made from medium term swings. A relative percentage derived between the trading volume that occured on both swings is also highlighted, and is used to determine if a maxima/minima is strong or weak.
Alerts
Built-in alerts are available for each supported market structure, including swing structures, internal structures, and equal highs/lows.